
Peace and Love Tour
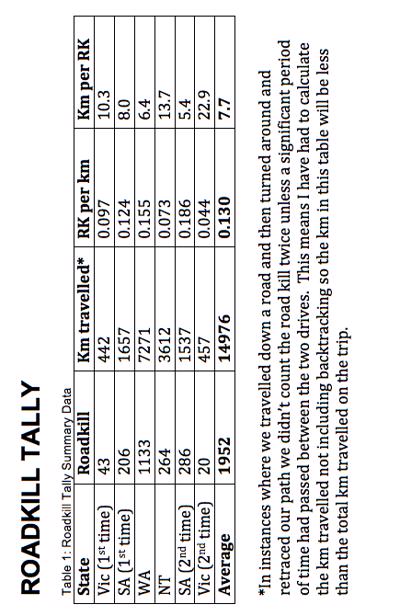
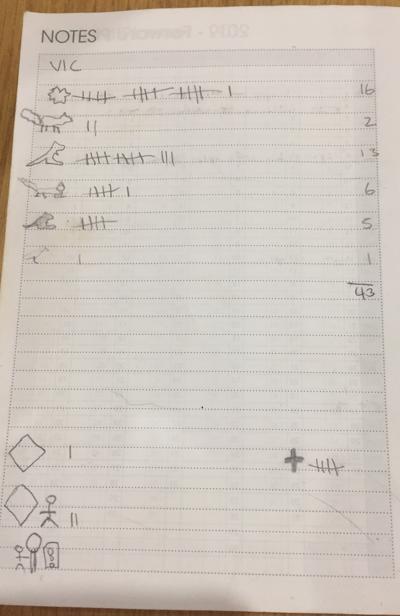
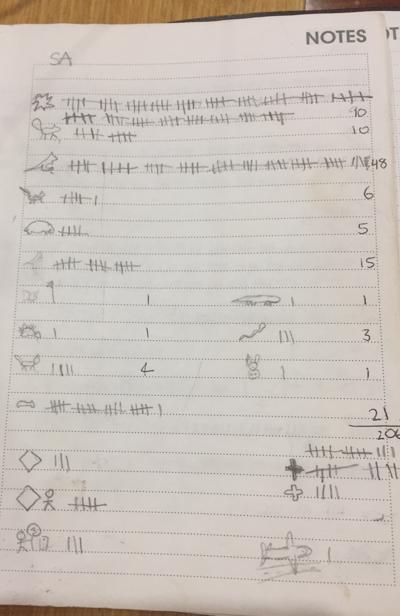
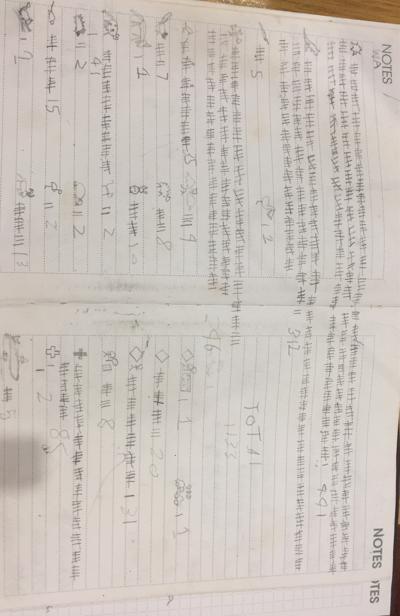
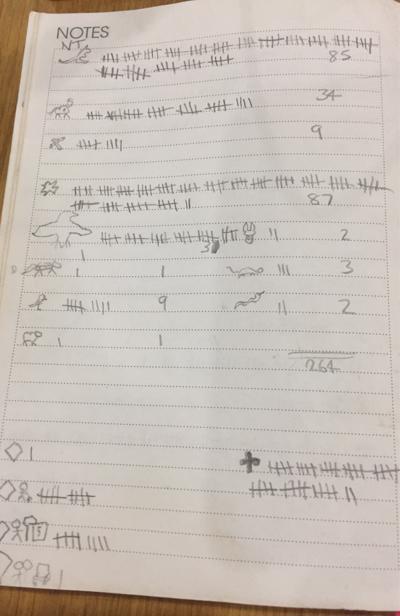
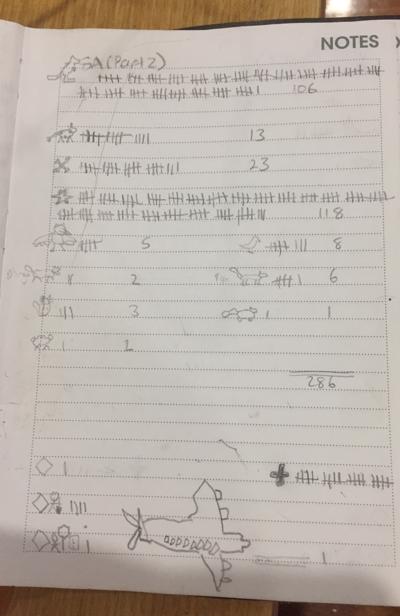
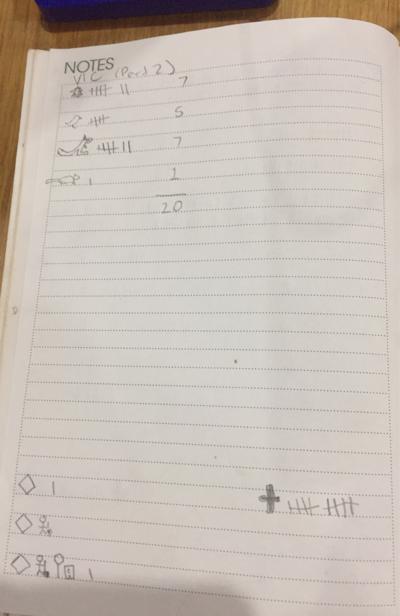
On the next page you can see our analysis of our road kill tally. Only animal roadkill is analysed here. We recorded the human road toll out of respect only. Raw data is found in the following images.
It should be noted that just because road kill is reported as higher doesn’t mean more animals were killed. We noted that in some areas a greater effort seemed to be made by local or state government to clean up the roadkill so only recent kills were visible, whereas in other regions many years worth of roadkill seemed to have accumulated and could be seen in varying stages of decomposition. Our ability to spot the roadkill may also have been affected by the time of day, light conditions, surrounding scrub and amount of oncoming traffic.
We also want to point out that the worst areas for road kill we experienced were in WA on the Nullabor for the first 200 km past Eucla, and the road between Karijini and Port Hedland. In the region near Port Hedland, travelling on the road used by lots of mining road trains, we counted 100 RK in approximately 80 km, giving a ratio of 1.25 RK per km, approximately 10 times that of the average road kill rate. This rate was maintained over several hundred kilometres so we estimate almost 30% of our WA totals was found on this one section of road, distorting the data for the rest of the state. Also in SA, up North between Coober Pedy and the border a similar effect was noticed, explaining why the SA (2nd time) data is 50% higher than the SA (1st time) data.
minmi.scouts
103 chapters
15 Apr 2020
Roadkill Tally
July 09, 2018
On the next page you can see our analysis of our road kill tally. Only animal roadkill is analysed here. We recorded the human road toll out of respect only. Raw data is found in the following images.
It should be noted that just because road kill is reported as higher doesn’t mean more animals were killed. We noted that in some areas a greater effort seemed to be made by local or state government to clean up the roadkill so only recent kills were visible, whereas in other regions many years worth of roadkill seemed to have accumulated and could be seen in varying stages of decomposition. Our ability to spot the roadkill may also have been affected by the time of day, light conditions, surrounding scrub and amount of oncoming traffic.
We also want to point out that the worst areas for road kill we experienced were in WA on the Nullabor for the first 200 km past Eucla, and the road between Karijini and Port Hedland. In the region near Port Hedland, travelling on the road used by lots of mining road trains, we counted 100 RK in approximately 80 km, giving a ratio of 1.25 RK per km, approximately 10 times that of the average road kill rate. This rate was maintained over several hundred kilometres so we estimate almost 30% of our WA totals was found on this one section of road, distorting the data for the rest of the state. Also in SA, up North between Coober Pedy and the border a similar effect was noticed, explaining why the SA (2nd time) data is 50% higher than the SA (1st time) data.
1.
Introduction
2.
Day 1
3.
Day 2
4.
Day 3
5.
Day 4
6.
Day 5
7.
Day 6
8.
Day 7
9.
Day 8
10.
Day 9
11.
Day 10
12.
Day 11
13.
Day 12
14.
Day 13
15.
Day 14
16.
Day 15
17.
Day 16
18.
Day 17
19.
Day 18
20.
Day 19
21.
Day 20
22.
Day 21
23.
Day 22
24.
Day 23
25.
Day 24
26.
Day 25
27.
Day 26
28.
Day 27
29.
Day 28
30.
Day 29
31.
Fremantle Prison
32.
Day 30
33.
Day 31
34.
Day 32
35.
Day 33 (Star Wars Day)
36.
Day 34
37.
Day 35
38.
Day 36
39.
Day 37
40.
Day 38
41.
Day 39
42.
Day 40
43.
Day 41
44.
Day 42 (Mothers' Day)
45.
Day 43
46.
Day 44
47.
Day 45
48.
Day 46
49.
Day 47
50.
Day 48
51.
Day 49
52.
Day 50
53.
Day 51
54.
Day 52
55.
Day 53
56.
Day 54
57.
Day 55
58.
Day 56
59.
Day 57
60.
Day 58
61.
Day 59
62.
Day 60
63.
Day 61
64.
Day 62
65.
Day 63
66.
Day 64
67.
Day 65
68.
Day 66
69.
Day 67
70.
Day 68
71.
Day 69
72.
Day 70
73.
Day 71
74.
Day 72
75.
Day 73
76.
Day 74
77.
Day 75
78.
Day 76
79.
Day 77
80.
Day 78
81.
Day 79
82.
Day 80
83.
Day 81
84.
Day 82
85.
The Grey Nomad
86.
Day 83
87.
Day 84
88.
Day 85
89.
Day 86
90.
Day 87
91.
Day 88
92.
Day 89
93.
Day 90
94.
Day 91
95.
Day 92
96.
Day 93
97.
Day 94
98.
Day 95
99.
Day 96
100.
Day 97
101.
Roadkill Tally
102.
Greg's Distance to Home Stats
103.
Oma's Story
Share your travel adventures like this!
Create your own travel blog in one step
Share with friends and family to follow your journey
Easy set up, no technical knowledge needed and unlimited storage!